
Abstract
Vitrinite reflectance data from sedimentary rocks sampled in 75 wells in western Venezuela has been obtained from three different laboratories and has been integrated as tightly as possible with sequence stratigraphy and with structural geology. Whereas, the results from the different laboratories differ greatly due to the paucity of the organic matter, the observed discontinuities are found in the same stratigraphic position. A detailed analysis of vitrinite reflectance can greatly help validate a stratigraphic correlation, even if the measured values are unreliable for geochemical calibration (burial history).
The following paragraphs will outline the non-conventional approach taken in our study and will demonstrate with a series of examples from Western Venezuela how far integration of vitrinite reflectance with other disciplines is possible. We will also outline the danger and unreliability of merging data set coming from different laboratories.
To understand how good integration can be it is important to remember that the stratigraphy and the geochemistry presented here were carried out totally independently. It was only later that we discovered how well the breaks in vitrinite plots matched the stratigraphy.
Approach
Burial history modelling software usually fits a curve or a couple of curves to the vitrinite data points. Vitrinite data from 75 wells provides an excellent data set which indicates that vitrinite data recorded by one interpreter can be used with relatively high level of confidence and to a high level of detail.
After a brief inspection of the trends encountered, we decided to "correlate" the vitrinite data with respect to depth in a non-statistical manner, thus, we used the following set of rules:
1) Lines linking vitrinite values should only connect data from one laboratory (and one interpreter)
2) Lines should connect the maximum number of consecutive data points possible; elimination of points can only be made only when absolutely necessary and with extreme parcimony. Regression lines can be used as a last resort or when the slope is more in line with other trends found at other levels or in neighbouring wells
3) Lines should be as long as possible when dealing with consecutive points
4) The fit between the line and the data points should be as perfect as possible
5) Lines connecting only two points should be accepted when a) the gradient is similar to other gradients encountered in the well; b) they simplify the overall picture; c) well or seimic data corroborate the isolation of these two points (the slope being in the latter case, not reliable)
A linear scale for Ro (vitrinite reflectance) was used because it improves identification of discontinuities and thus, it provides a better integration tool and a better correlation with stratigraphic and tectonic discontinuities. These discontinuities are visible but less obvious on a logarithmic scale.
Through a series of examples we will outline various aspects of integration between vitrinite data and stratigraphic or structural features. The following paragraphs describe some of the examples that will be given with more supporting material.
Correlation between vitrinite and stratigraphy in one well
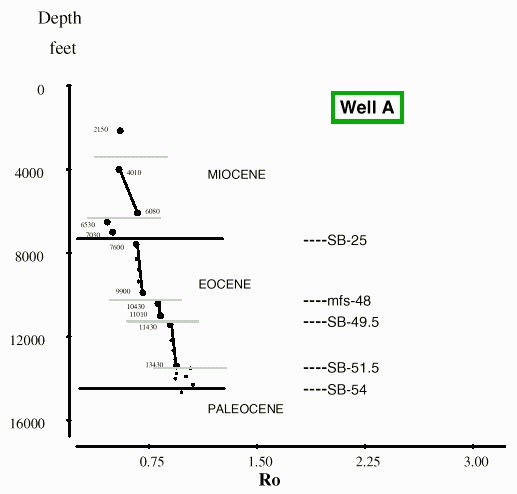
Within the Eocene section of Well A, five important sequence boundaries and maximum flooding surfaces which were identified using seismic and log data, coincide with discontinuities on the Ro versus depth plot (Fig.1). A line linking only two points (10430' and 11010') is considered acceptable because the resulting trends are all parallel to each other. The reason for the shift is not yet understood but is significant from a stratigraphical perspective.

Figure 1 Correlation between vitrinite trends and sequence stratigraphy
Reliability of detailed observations despite large variations between values obtained by different laboratories
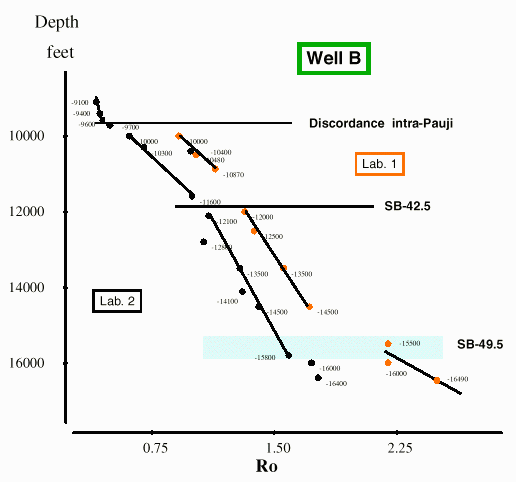
In Well B (Fig 2), vitrinite data obtained by two different laboratories are significantly different, which is very common for estimation of vitrinite because of the interpretative nature of the estimation. The observed trends, however, are perfectly parallel. On one hand, the choice of laboratory and interpreter will drastically affect our perception of the burial history and the time of hydrocarbon generation. On the other hand, the vitrinite data obtained by any single interpreter shows discontinuities at specific stratigraphic levels. This provides a degree of confidence as to how far vitrinite data can be used as a geological, correlation tool.
Closer inspection of Figure 2 shows that a single data point from one laboratory falls on the trend of the other laboratory. This implies that there is a problem in the identification of "true" vitrinite. Thus, interpreters may take desmocollinite or oxidized vitrinite for telocollinite which is the true vitrinite (Peters and Casa, 1994).

Figure 2 Similarity of vitrinite trends despite differences between laboratories
Correlation of data from two neighbouring wells
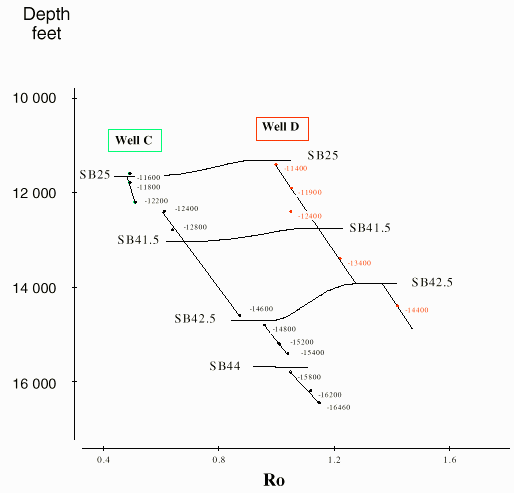
In Well C (Fig.3), three parallel trends are observed, each one linking three data points. The discontinuities in vitrinite trends coincide with some sequence boundaries observed in the wells and can be identified on 3-D seismic.
A study of Well C alone, however, was not successful in predicting the location of the sequence boundaries: the obvious correlation between the points did not tie with stratigraphy (linking the three lower points together). Taking into consideration the vitrinite data from Well C, and characteristics such as the shift of vitrinite values at the level of SB-42.5, we were able to obtain a close match between the vitrinite data and the stratigraphy which lends credibility to the stratigraphic interpretation made in Well D.

Figure 3 Correlation of vitrinite data from two wells
Variations in Ro gradients due to variations in structural dip
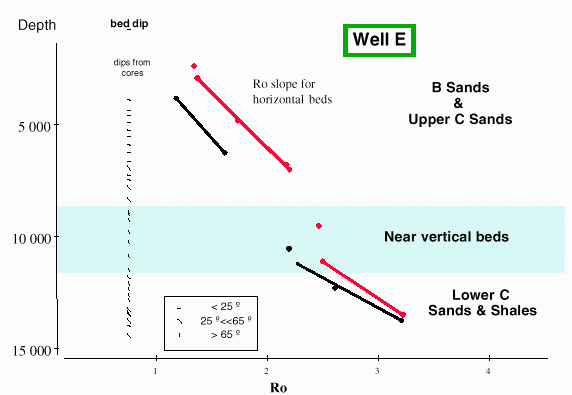
Changes in dip have a direct influence on the gradient of Ro if the values are not related to present day heat flow (Chatellier et al, 1998). Tectonic overprinting may influence Ro versus depth trends to such extent that vertical beds may exhibit similar Ro values over large intervals. Various examples will illustrate this point (one of them is shown in Fig.4).
Limitation of the method
A few wells have remained mysteries despite the multiple results from various laboratories. We will discuss some of the possible reasons and some of the limitations of the method used. The amount of values and the density of the data points is crucial if a good integration with stratigraphy is expected. Factors such as lithology and overpressure zones can only be outlined if at least two points (preferably more than 3) have sampled these zones of interest.

Figure 4 Similarity of trends irrespective of the laboratory used
Conclusions
A detailed analysis of vitrinite reflectance can greatly help validate a stratigraphic correlation, even if the measured values are unusable or unreliable for geochemical calibration (burial history).
Discontinuities observed in Ro versus depth plots are visible for various reasons such as 1) changes in maceral type when there is a shift in sedimentary influence; 2) overpressure zones due to the highly shaly nature of some units; 3) dip changes due to tectonic overprint; 4) missing sections due to faulting or erosion.
Many sequence stratigraphic breaks coincide with changes in vitrinite/depth plots because they correspond to radical changes in the sedimentation pattern (type and supply), with the associated changes in maceral composition.
Reference
Chatellier, J-Y, Mendez, M.J., Hague, P., and Navarro, A., 1998, Shale mobility in Western Venezuela, implications for maturity studies and prospectivity, AAPG Salt Lake City, May 17-20 1998, Extended abstract
Peters, K.E. and Casa, M.R., 1994, Applied Source Rock Geochemistry, In L.B. Magoon and W.G. Dow The petroleum system – from source to trap: AAPG Memoir 60, p.93-120
¹ PDVSA-Intevep. Los Teques, Edo. Miranda, Venezuela.